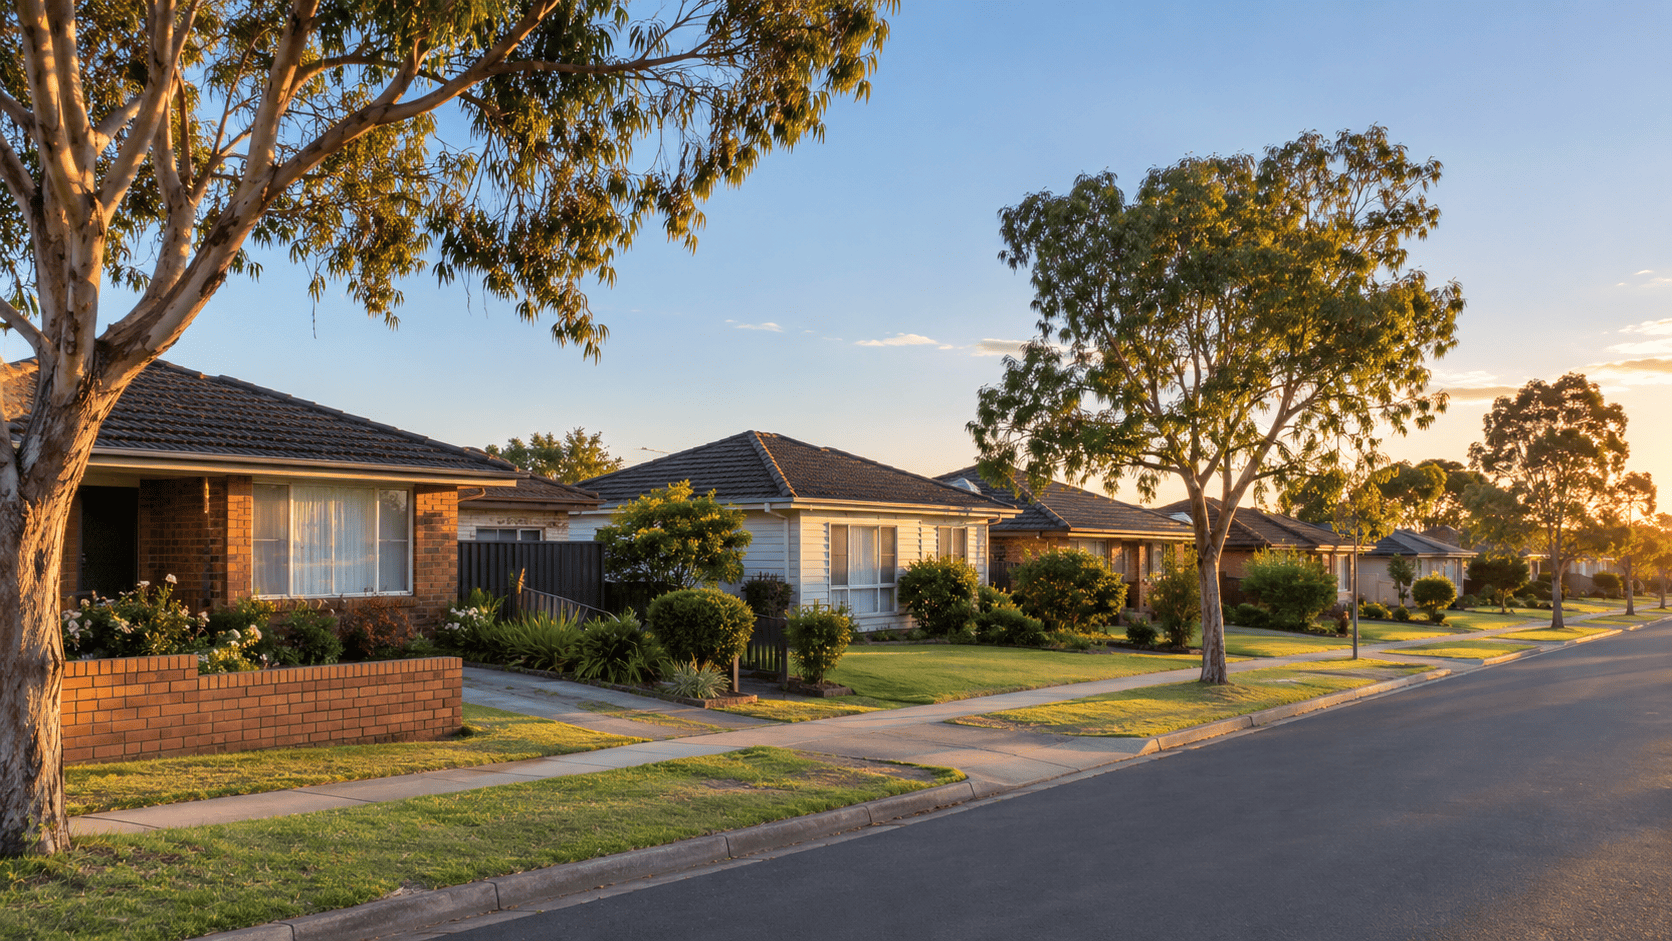
Busby’s median house price is $1,025,000, up 13.9% over the past 12 months on Cotality data. The clearest signal on demand is how little is for sale: 60 houses sold in that year, yet only seven properties were listed for sale in Busby on OnTheHouse when we checked on 9 October 2026.
That’s the Busby property market in two sentences. Below is where the numbers come from, how much weight they can carry in a suburb this small, and what they mean for owners, buyers and investors. For schools, transport and shopping, see our complete Busby suburb guide.
What is the Busby property market like in 2026?
Busby is a tight, house-dominated market. The median house sale price is $1,025,000, up 13.9% in 12 months, with 60 house sales and an average of 24 days on market (Cotality). Supply is thin, rents sit around $580 a week, and gross yields are low at about 2.9%.
Busby house prices: the 12-month picture
Busby houses, last 12 months | Figure |
|—|—|
Median sale price | $1,025,000 |
Change over 12 months | +13.9% |
Houses sold | 60 |
Average days on market | 24 days |
Average vendor discount | –6.4% |
Source: Cotality via propertyvalue.com.au, last 12 months, checked October 2026.
Sixty sales is about five a month. Keep that in mind.
A median built on so few sales moves with whichever homes happened to sell. A run of renovated four-bedders on big blocks lifts it, and a quarter of original three-bedders drags it down. Read the 13.9% as “prices rose solidly”, not as what your own house gained.
Cotality publishes an average days on market for Busby, not a median. Twenty-four days is quick, but one overpriced listing sitting for months drags an average up. We couldn’t find a median from an official source, so we haven’t quoted one.
The vendor discount is more telling. On average, Busby sellers accepted about 6.4% below their original asking price, which usually means a home started above what buyers would pay.
The longer trend: what the five-year numbers do and don’t show
Neither Cotality nor the NSW Government publishes a free year-by-year median for a suburb this size, so there’s no table of annual medians here. We’d rather leave it out than guess.
OnTheHouse (also Cotality data) does publish a five-year growth figure, based on estimated values for every Busby house, sold or not. Watch it move across three monthly updates:
As at | Busby houses: 5-year change in median value |
|—|—|
30 June 2026 | +48.12% |
31 July 2026 | +43.73% |
31 August 2026 | +36.63% |
Source: Cotality via OnTheHouse, Busby suburb data.
Same suburb, same provider, an almost 12-point swing in two months.
Busby homes didn’t lose value over winter. The five-year window rolls forward monthly, so its starting point keeps changing, and the model works from a thin set of local sales. The honest summary: Busby houses grew by well over a third across five years on every snapshot, and any single precise figure claims more certainty than the data holds.
Houses vs units, townhouses and duplexes
There aren’t enough unit, townhouse or duplex sales in Busby for a reliable sale-price median. The closest figures are OnTheHouse model estimates as at 31 August 2026: a median unit value of $728,397 and median unit rent of $470 a week. They aren’t sale results and don’t split townhouses from duplexes.
What sells in Busby, and what holds a home back
Most Busby homes are older single-level houses on decent blocks, and buyers are often pricing the land and its potential as much as the house.
Block size and shape. A wide, level block leaves room for a granny flat, an extension or a future rebuild. Narrow or sloping blocks shrink the buyer pool.
A granny flat, done properly. An approved one appeals to families and investors alike. An unapproved one raises questions in the buyer’s building report and with their lender, so deal with it before you list, not mid-campaign.
Development potential. Some buyers pay for the chance to add a duplex or second dwelling. Whether a lot qualifies depends on zoning, size and frontage, so check the NSW Planning Portal or Liverpool City Council rather than what a neighbour did years ago.
Condition and presentation. Buyers price in every job they can see, and fixing the obvious usually costs less than the discount they’ll ask for. With only a handful of listings at once, the homes with clean, bright photos get the inspections.
If you’d like BJ to go through which of these apply to your home, start with a free property appraisal, or read how home values are worked out.
Busby’s rental market: rents, yields and who lives here
The median house rent in Busby is $580 a week over the last 12 months (Cotality via propertyvalue.com.au). OnTheHouse snapshots show $580 at the end of June and July 2026 and $590 at the end of August. That’s too short a window to call a trend, but house rents are holding around that level.
On 9 October 2026, OnTheHouse showed just 10 properties listed for rent in a suburb of roughly 1,480 properties.
The gross yield, worked out
Step | Working |
|—|—|
Annual rent | $580 × 52 weeks = $30,160 |
Gross yield | $30,160 ÷ $1,025,000 ≈ 2.9% |
Before council rates, water, insurance, management, maintenance and vacancy. Net yield will be lower.
At the 2021 Census, 44.7% of Busby homes were owner-occupied, down from 47.7% in 2016. Fewer than half are lived in by their owners, so renting is a big part of how the suburb works.
Postcode 2168 figures. The NSW Government’s Rent and Sales Report (Communities and Justice) publishes rents and sales by postcode. Its 2168 figures cover Busby plus seven other suburbs, so they won’t match the Busby-only numbers above. We haven’t quoted them here; the latest quarter is on the Communities and Justice website.
Where Busby sits in 2168
Busby is one of eight suburbs in the 2168 postcode, and buyers shopping in 2168 will compare your home with sales a few streets away in the neighbouring suburbs. We line all eight up in our 2168 property market update.
What the Busby property market means for sellers
On paper, conditions suit you: prices rose over the year and there’s little competing stock.
But with around 60 house sales a year, buyers will check your price against every recent sale nearby. Price to that evidence, not the 13.9% headline; the 6.4% average vendor discount shows plenty of sellers started too high. The steps to selling cover the process, and a free appraisal with BJ will show where your home sits in Busby’s range.
What it means for buyers
With few listings at any one time, have finance pre-approval sorted and know your limit before you start. Check sold prices yourself (see below) rather than relying on asking prices or headline medians. Rates will shape your budget more than anything here, so check rba.gov.au for the current cash rate and talk to your lender.
What it means for investors
Busby is a growth suburb more than an income one. A 2.9% gross yield won’t cover the holding costs of a heavily borrowed purchase, so run the numbers on your own loan.
The rental side is steady: fewer than half of homes are owner-occupied, few rentals are listed at once, and house rents have held around $580 a week. A compliant granny flat can add a second rent on one title, subject to approval. If you’d rather not manage tenants yourself, our property management team looks after rentals across Busby and 2168.
How to read these numbers (and why websites disagree)
Different websites show different Busby medians, mostly because they measure different things. The $1,025,000 figure is the middle of actual house sales over 12 months. OnTheHouse’s $964,093 (as at 31 August 2026) is the middle of estimated values for every Busby house, sold or not. Update dates differ, and some sites blend houses with units. Even Cotality’s own Busby page on propertyvalue.com.au shows a $580 median rent in one panel and $590 in another.
And a median isn’t your home’s value. Half of sales were above it and half below; your block, condition, bedrooms and street set your number.
Check sold prices yourself. The NSW Valuer General publishes property sales information at valuergeneral.nsw.gov.au, where you can see what Busby homes actually sold for. The newest sales take time to appear, because records come through after settlement.
Busby property market FAQs
What is the median house price in Busby?
The median house sale price in Busby is $1,025,000 over the last 12 months, up 13.9% (Cotality via propertyvalue.com.au, October 2026). With only around 60 house sales a year, it can shift noticeably between updates.
How long do houses take to sell in Busby?
Houses in Busby took an average of 24 days to sell over the last 12 months, according to Cotality. That is an average rather than a median, so a few slow sales can pull it up.
What is the average rent in Busby?
The median house rent in Busby is $580 a week over the last 12 months (Cotality via propertyvalue.com.au). OnTheHouse estimated units at $470 a week as at 31 August 2026.
What rental yield can investors expect in Busby?
At a $1,025,000 median price and $580 a week rent, the gross yield is about 2.9% before costs. Net yield will be lower.
Is Busby a good place to buy in 2026?
We don’t forecast prices. The data shows a house-dominated suburb with tight supply and strong growth over one and five years. Whether it suits you depends on your budget, timeframe and the specific home.
Want to know where your home sits in Busby’s range?
BJ Gregory has spent more than 20 years working across Green Valley, Busby and the wider Liverpool area, and is a second-generation real estate agent in Busby and surrounds. For a free, no-obligation appraisal based on real Busby sales, call BJ on 0422 333 333, email bj@gregory.agency or contact us.