
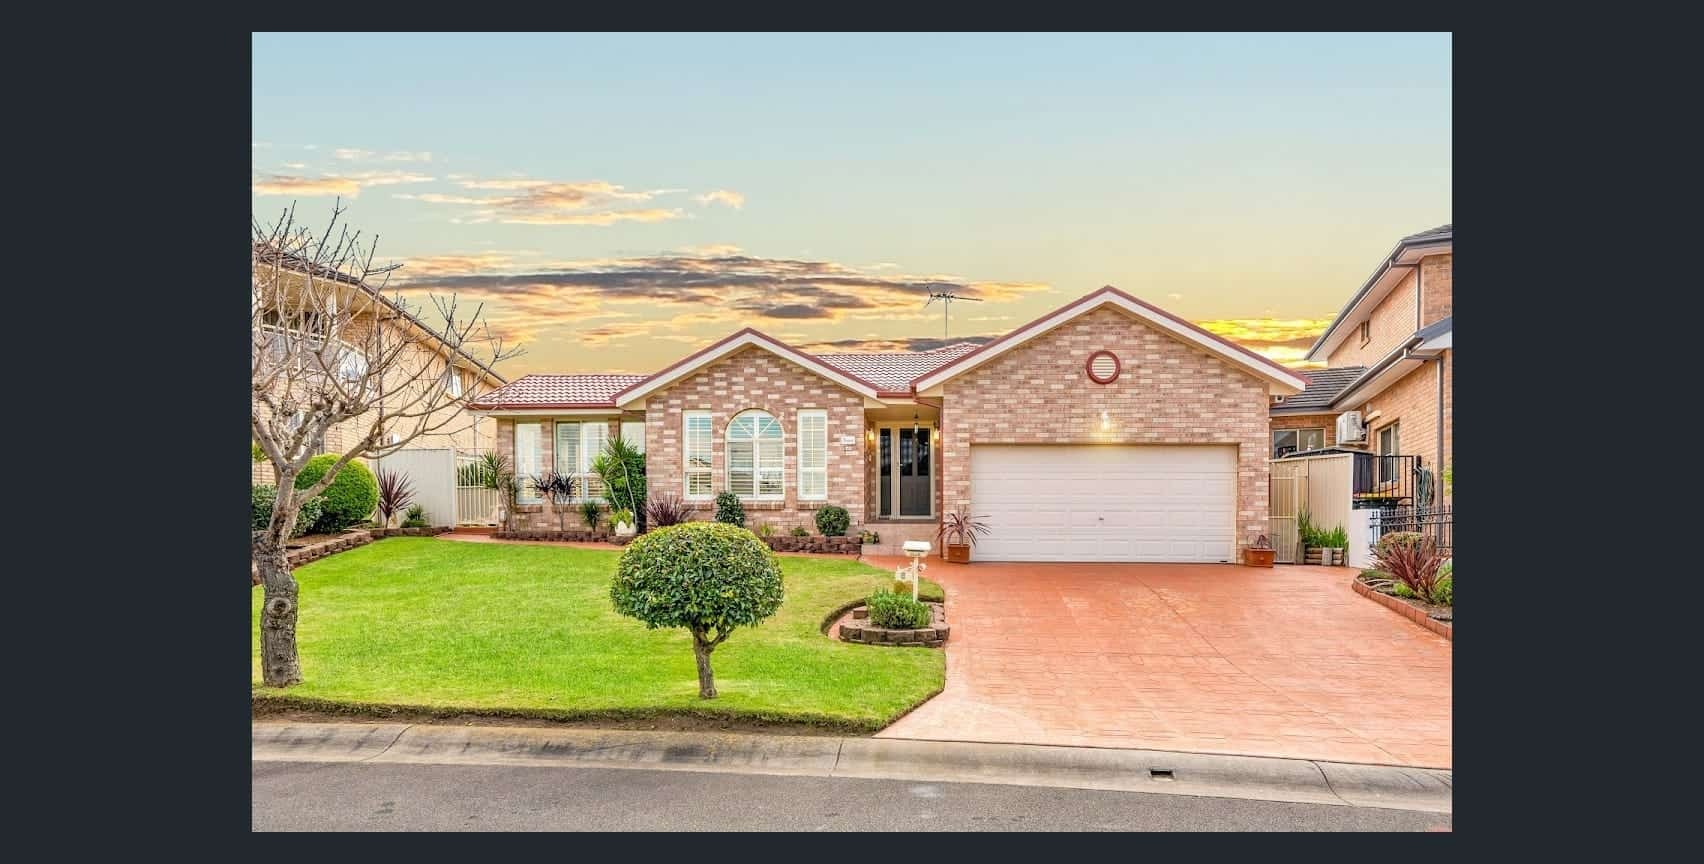
If you want to understand Busby property prices in 2026, you’re in the right place. Buyers, sellers, and investors across Liverpool’s south-west area all want the same thing. They want real numbers, not guesswork. This guide covers the current median house price, recent growth, rental yields, and how Busby stacks up against nearby suburbs. You’ll also find a short forecast and answers to the questions buyers ask most.
Why does this matter? Busby has quietly become one of the more affordable spots in Sydney’s property market. Prices here move faster than most people think. BJ Gregory has watched this shift firsthand, street by street, for over twenty years.
A Quick Snapshot of Busby, NSW
Busby sits about 36 kilometres south-west of the Sydney CBD. It falls inside the City of Liverpool local area. The suburb dates back to the 1960s. Today it’s a close-knit, multicultural community of roughly 4,400 people. Families make up a large share of that population. The median age sits around 32, younger than most of Sydney.
Local shops, parks, and two solid schools give the area a real neighbourhood feel. Those schools are Busby Public School and James Busby High School. For bigger shopping trips, residents usually head to nearby Miller or the larger Westfield Liverpool. Regular buses connect Busby to Liverpool and the wider Sydney network. Weekends often bring families to local parks and sporting fields, which adds to that neighbourhood feel. None of this shows up in a spreadsheet. However, it shapes how Busby property prices behave day to day.
A Bit of History: How Busby Has Changed
Local authorities built most of Busby’s original housing in the 1970s and 1980s. Back then, it served as public housing for working families moving into Sydney’s growing south-west. That history still shapes the suburb today. You’ll find a strong sense of community and real cultural diversity here, with neighbours who’ve often lived on the same street for decades.
Over the past decade, things have shifted. More owners have moved in. Renovations have picked up. First-home buyers have found what locals already knew: Busby offers space and value that’s hard to find closer to the city. Busby has shifted from a rental-heavy suburb to a more balanced mix of owners and renters. That’s one of the quiet stories behind rising Busby property prices.
This background matters. It explains why growth here looks different from suburbs that were always in demand. Busby isn’t riding a wave of hype. It’s catching up to fair value after years of being overlooked by buyers who once looked straight past it toward flashier postcodes.
Busby Property Prices in 2026: What’s the Median House Price?
Current Median House Price
So, what’s the median house price in Busby right now? Recent data from property researchers puts it somewhere between $950,000 and $1,050,000. The exact figure depends on the source and the month measured. That range reflects around 50 to 60 house sales over the past year. Most homes sell within three to five weeks of listing.
Busby property prices in 2026 sit well below the greater Sydney median, which currently tops $1.6 million. That gap explains why so many first-home buyers and upgraders now look here instead of closer to the city. Unit sales stay rare in Busby. Most of the action happens in the housing market.
Price Growth Over the Past Year
Busby has recorded strong annual growth. Several reports show gains of between 10% and 13% over the past year. That’s a big jump for a suburb once known mainly for its public housing.
Quarterly growth has been more modest, usually sitting around 1%. This pattern points to steady, sustainable movement, not a short-term spike. Therefore, buyers shouldn’t expect a sharp cool-down any time soon. Still, nothing in real estate ever comes with a guarantee.
Busby Property Price Data at a Glance
Here’s a quick snapshot of Busby property prices in 2026, pulled together in one spot so you don’t have to dig through multiple reports. Use it as a fast reference, then read on for the detail behind each number.
| Metric | Approximate Figure |
|---|---|
| Median house price | $950,000 – $1,050,000 |
| Annual growth | 10% – 13% |
| Quarterly growth | ~1% |
| Median weekly rent (houses) | $530 – $580 |
| Gross rental yield | 2.6% – 3.7% |
| Average days on market | 19 – 38 days |
| Distance from Sydney CBD | ~36 km |
| Population | ~4,446 |
These figures come from a mix of recent property data sources. Reports update monthly, so always check current numbers with a local agent before you make a decision.
Is the Busby Property Market Rising or Cooling in 2026?
Stock on market in Busby stays tight. That scarcity props up prices even when the wider economy shifts. Listings tend to move fast compared with many other Sydney suburbs. Buyer competition stays fairly steady rather than seasonal.
Demand comes from two main groups. First-home buyers get priced out of suburbs closer to the CBD, so they turn to Busby. Investors chase affordability over yield here too. Meanwhile, new building approvals stay low. That means no sudden wave of new homes looks likely soon. All of this points toward steady, gradual growth in Busby property prices rather than a boom-and-bust cycle. A tight market like this tends to reward quick movers. Buyers who wait for a bargain may end up disappointed.
Busby Rental Market and Investment Yield
If you’re eyeing Busby as an investment, rental numbers matter just as much as sale prices. Median weekly rent for houses sits between $530 and $580. Gross rental yield, or the yearly rent you collect as a share of the purchase price, runs around 2.6% to 3.7%.
That sits below the 3% mark many investors use as a rough benchmark. However, a lower yield doesn’t always mean a poor investment. Capital growth in Busby has outpaced yield in recent years. This suits investors playing a longer game rather than chasing weekly cash flow.
A few numbers worth remembering:
- Median weekly rent (houses): $530–$580
- Gross rental yield: 2.6%–3.7%
- Vacancy rate: low, which points to steady tenant demand
- Typical tenants: families and long-term renters, meaning fewer vacancies and steadier rental income
Busby vs Nearby Suburbs: How Does It Compare?
Buyers often compare Busby with Green Valley, its neighbour just across the Liverpool area. Green Valley’s median house price sits noticeably higher, generally above $1.1 million. Busby remains one of the more affordable options nearby.
Suburbs like Miller, Cartwright, and Ashcroft sit in a similar price bracket to Busby. They offer similar affordability and access to the same transport routes. Meanwhile, Hinchinbrook and parts of Liverpool proper trend higher again, thanks to bigger blocks and newer homes. For buyers stretching every dollar, this makes Busby one of the last genuinely affordable pockets close to Liverpool’s growing town centre. Lifestyle-wise, the differences between these suburbs are often smaller than the price gap suggests. That’s part of why savvy buyers keep circling back to Busby.
| Suburb | Approx. Median House Price | Notes |
|---|---|---|
| Busby | $950K – $1.05M | Most affordable of the group |
| Green Valley | $1.1M+ | Slightly more established |
| Miller / Cartwright / Ashcroft | Similar to Busby | Comparable affordability |
| Hinchinbrook | Higher again | Larger blocks, newer stock |
Why Buyers Are Choosing Busby in 2026
Price is only part of the story. Buyers keep choosing Busby for simple, everyday reasons that don’t always show up in a market report.
- Affordability: prices sit well below Sydney’s $1.6 million-plus median
- Family-friendly schools, parks, and a real community feel
- Transport: bus links and the T-way make getting around manageable
- Ongoing renewal projects across the wider Liverpool area
- A shorter commute compared with suburbs further south-west
Together, these factors explain why demand keeps outpacing supply, even as prices climb. Busby offers a rare mix: real affordability today, plus genuine upside as Liverpool’s town centre keeps growing.
Tips If You’re Buying in Busby
Buying in a rising market takes a bit more strategy than simply falling for a house. A few things worth checking before you make an offer:
- Compare recent sale prices on the same street, not just the suburb average
- Get your finance pre-approved before you start inspecting homes
- Check flood and bushfire overlays, since these can affect insurance and resale value
- Ask about upcoming infrastructure or rezoning plans nearby
- Walk the street at different times of day, since traffic and noise can change a lot
If you’re weighing your options, it helps to start your property search with someone who tracks these streets daily, not just portal listings.
Tips If You’re Selling in Busby
Selling in a growing suburb still needs the right strategy. Rising prices don’t guarantee a strong result if you price or present a home poorly.
- Get a current, data-backed appraisal rather than relying on last year’s figures
- Present the home well: fresh paint, tidy gardens, and decluttered rooms go a long way
- Choose between auction and private treaty based on real local buyer demand, not habit
- Time your listing around school terms and holidays
- Keep paperwork ready early, including building reports and council certificates
A free appraisal from Gregory Property Agents gives you an honest starting point, built on comparable sales rather than guesswork.
2026–2027 Price Forecast for Busby
Nobody can predict property markets with total certainty. Any agent who claims otherwise isn’t being straight with you. That said, the fundamentals in Busby point toward steady, moderate growth through 2026 and into 2027.
Tight supply, steady population growth across the Liverpool area, and ongoing infrastructure work all support this outlook. BJ Gregory has watched similar patterns play out in Green Valley and Liverpool over the past two decades. Busby appears to be following a familiar path: gradual, steady gains rather than sudden spikes. Of course, interest rates and the wider economy will always play a role. So it pays to stay updated rather than relying on numbers from a year ago.
Thinking of Buying or Selling in Busby?
Numbers only tell part of the story. Recent comparable sales, current buyer demand, and what’s happening street by street matter just as much as suburb-wide averages. That’s where real, on-the-ground experience from BJ Gregory makes the difference.
If you’re considering buying, start by browsing current listings and speaking with someone who knows these streets personally. If you’re weighing up selling, request a free property appraisal for an honest, data-backed valuation, not an inflated number meant to win your listing. And if you already own an investment property here, professional property management can take the day-to-day pressure off your plate. Good management also protects your rental income over the long run. Well-kept properties attract better tenants and fewer costly surprises.
Final Thoughts
Busby property prices in 2026 tell a fairly clear story: steady growth, tight supply, and real affordability compared with the rest of Sydney. Whether you’re buying your first home, growing an investment portfolio, or thinking about selling, these basics are worth your attention.
Get in touch with BJ Gregory today for a free, no-obligation appraisal. Or simply chat about what these numbers mean for your next move in Busby.
Frequently Asked Questions
What is the median house price in Busby NSW in 2026?
Most recent reports put the median house price in Busby somewhere between $950,000 and $1,050,000, depending on the data source and month. That’s well below the wider Sydney median, which makes Busby an attractive option for buyers seeking value.
Is Busby NSW a good place to live?
Yes, for many families it is. Busby offers affordable housing, local schools, parks, and a genuinely multicultural, close-knit community. It sits within easy reach of Liverpool’s shops, services, and transport links, without the price tag of suburbs closer to the CBD.
Is now a good time to buy in Busby?
Timing always depends on your personal situation. Still, the fundamentals look supportive. Tight supply, steady demand, and consistent growth all suggest the market has room to keep moving, rather than facing a sharp correction.
How far is Busby from Sydney CBD?
Busby sits roughly 36 kilometres south-west of the Sydney central business district, within the City of Liverpool local area.
Are property prices rising in Busby?
Yes. Recent data shows annual growth of around 10% to 13%, with quarterly growth sitting closer to 1%. That points to steady, lasting gains rather than a short-lived spike.
What is Busby known for?
Busby stands out for its affordability, its strong sense of community, and its multicultural population. It also carries a history rooted in public housing. Even so, the suburb has shifted toward a more balanced mix of owners and renters over the past decade.
What suburbs are similar to Busby?
Miller, Cartwright, and Ashcroft sit closest in price and lifestyle. Green Valley and Hinchinbrook cost more, though they offer a similar family-friendly feel. Comparing a few nearby suburbs side by side often helps buyers work out which one truly fits their budget and daily routine.